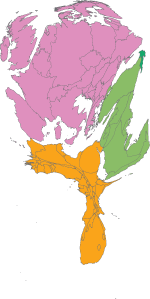
 It’s now a few weeks since we published the Carbon Map and we’ve been thrilled with the response. So far we’ve had around 100,000 views, 5,000 shares (including the Guardian version), dozens of suggestions and offers of data, and write-ups in locations as diverse as Brazil, France and US. We’ve heard from teachers who want to use the site in classrooms from Scotland to India, academics who want to reproduce some of the maps in a journal article, and an organisation that may want to commission a whole new site.
Best of all, though, have been all the lovely tweets and comments, including a few from members of the public encouraging us to do more to make data easy to understand. Here’s my favourite:
As someone who never grips with graphs or lists of numbers, I wanted to drop into your bit of the ether to say thank you for creating your wonderful carbon map [and] for making important information more inclusive.
It’s also been nice to see tweets from cartography and infographic experts who have grudgingly liked our approach:
Normally don’t like this kind of #cartogram but something about watching it change is cool. (William McNulty, Director of Maps at National Geographic Magazine)
So, all in all a really pleasing response. Thanks to everyone who’s been in touch.